homepage | Data Visualization With R: Five Questions With Dr. Neal Wilson
April 18, 2022
April 18, 2022

Dr. Neal Wilson, who teaches Data Visualization With R, answers five questions about how he uses the programming language in his data analysis work.
“Learning R changed the course of my career. I like opening the door to the R environment for people, introducing them to some of what R can do,” says Wilson, the Senior Research Associate at the Center for Economic information and Special Faculty in the School of Critical Studies at the California Institute of the Arts.
His research is focused on understanding the relationships between pediatric lead poisoning and the built environment. Dr. Wilson uses Geographic Information Systems (GIS) and the R programing language to understand, visualize, and communicate empirical relationships in his health disparities research and publications.
His two-part workshop leverages R as a tool for creating visually appealing and persuasive data stories. Data Visualization With R runs Tuesday, May 3, 1–4 pm, and Saturday, May 7, 9 am–12 pm. Register today while space is available.
Can you offer a brief example of how you use R and GIS in your work?
In my work, focused on the intersection of housing and health, I am constantly using R and GIS to analyze and visualize data. I mainly use GIS for mapping and spacial association of geographic information. Mapping is a good skill to have for storytelling with data. R is my workhorse program, I use it to query data directly from places like the Census bureau, I use it to clean messy data. I use R to get a quick graphical look at my data and for exploratory data analysis. I use R as the environment to write my reports, perform my final data analysis and visualize all manner or trends and associations in my research.
What trends do you see regarding usage or adoption of R in data-rich industries?
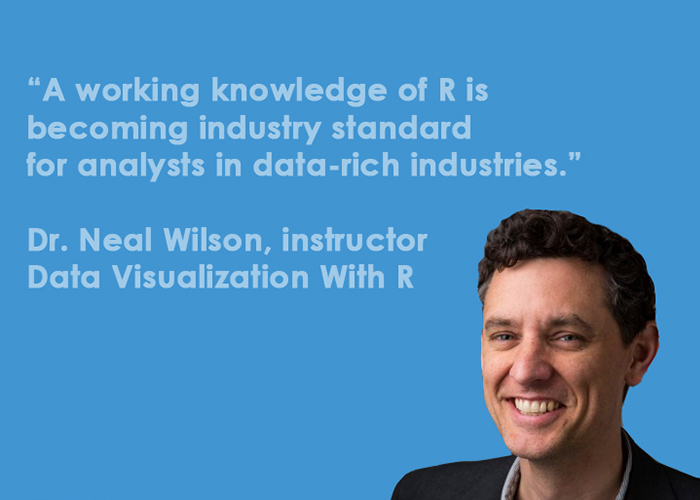
R is very good for data visualization and analysis applications. There are an increasing number of people using R for a widening array of applications. With R markdown you can embed your analysis and visualizations directly into your reports and presentations without having to change programs. Its functionality and low overhead costs mean that a working knowledge of R is becoming industry standard for analysts in data-rich industries.
Is this course helpful for someone who works with large amounts of data, but isn’t necessarily a data analyst or data scientist? If so, how?
If you work with data you have to know what’s there and when you are doing basic activities like sub-setting across multiple variables you need to know exactly what you have done and how to do it again. R has some incredibly powerful and useful ‘out of the box’ applications for organizing, arranging and understanding your data. One of the advantages of working with R is that it gives you the ability to design reproducible processes that can be reused and recombined to handle repeating tasks. R code can be shared among coworkers to generate consistent output.
Would you share some examples of how R is used to visually communicate data analysis?
I use R to visualize connections graphically between housing and health outcomes. So a typical paper I write will have 10-12 graphs just showing the raw relationships between variables. After I have R do some statistical analysis for me I need to see the I use it to visualize the results of my statistical analysis.
R has hundreds of packages to accomplish the same task. How does a user choose or learn the best package for the task at hand? Do you offer guidance on strategies or approaches?
This is a really good question. I recommend starting with the tidyverse family of packages. These packages are designed to work together and they can handle most of your day-to-day needs. But an important part of working in R is accessing the variety of peer support networks that discuss how to use the various packages. It takes a little bit of practice to figure out how to tap into these knowledge networks. So build up your core capabilities in tidyverse and work on tapping in the joint stock of knowledge out there.
Workshop begins May 3. Register for Data Visualization With R, a live workshop led by Dr. Neal Wilson. Topics include:
